Ever wondered what makes top Pinterest creators stand out? They excel in making eye-catching infographics. And the good news is, you don’t have to be a design expert to do the same. Canva is here, and it’s making it easy for anyone to design amazing visuals for Pinterest.
This article will show you how to use Canva to create infographics that catch people’s eyes. These infographics will pull more people to check out what you share online. Now, here’s a tricky question about Pinterest: Who is the most popular person on Pinterest, and how much do they make? The answer might just surprise you. Let’s explore how you can create and share Pinterest infographics to succeed.
Canva for Creating Pinterest Infographics
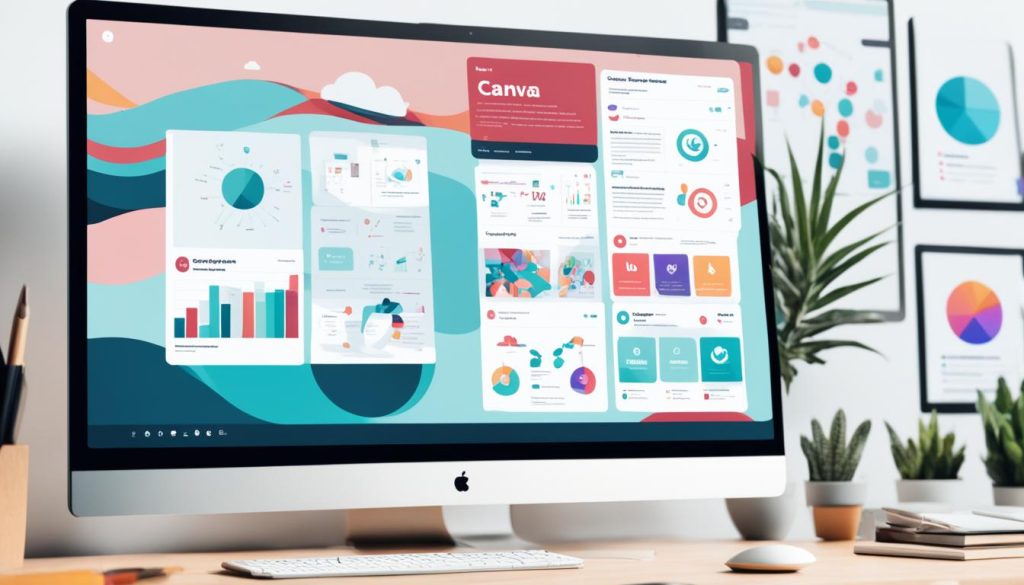
Canva is a simple design platform that lets you easily make eye-catching infographics for Pinterest. With its drag-and-drop feature and ready-to-use templates, designing becomes a breeze. You don’t have to be a pro to make your infographics look professional.
It even offers branding and styling tools to keep your infographics in line with your brand identity. And the best part, you can do all this for free. No need for fancy software or design know-how.
Why Infographics Matter for Pinterest Marketing
Infographics shine on Pinterest because they look great and catch the eye in the Pinterest feed. They are great for sharing data and stories clearly. This makes it simple for people to understand complicated ideas. When used, infographics can make your Pinterest content more noticed and shared.
Visually Appealing Content Stands Out
In the world of social media, captivating content is key to getting noticed. Pinterest infographics are made with vivid images and clear info. This design helps them grab attention in feeds, which can boost your content’s visibility and interaction.
Infographics Are Perfect for the Pinterest Feed
The layout of Pinterest, focused on tall images, fits infographics well. They can summarize your content in an attractive way. This not only saves time for users but also offers valuable insights.
Convey Data and Tell Stories Effectively
Infographics are unbeatable for presenting data clearly and interestingly. They use bright colors and smart design to tell stories. This approach makes sure your audience gets the main points and remembers them.
Adding Pinterest infographics to your marketing mix is very effective. They engage people, draw them to your site, and support reaching your business aims on the platform.
5-Step System for Standout Pinterest Infographics
To make Pinterest infographics that really shine, you must follow a 5-step system. This involves choosing a great topic, getting creative, and making your design just right. By doing this, your infographics will catch people’s eyes and get them to interact with your posts.
Picking the Right Topic
Start by picking a topic that your audience will love. Take time to research and find a design and topic that grabs their attention. Make sure it’s related to what they care about in your field or business.
Be Creative, Funny, or Useful
Make your Pinterest infographic memorable by aiming for a strong reaction. You can do this with creative designs, funny content that makes people smile, or by offering something useful. These approaches will help pull in views and boost activity on your posts.
Keep It Simple
Remember: simple designs work best for Pinterest infographics. Use a clear layout with just 3-5 main points and a simple call-to-action. Too much info or messy visuals can turn people away, so keep it clean.
Nailing the Look and Feel
Make sure your infographic matches your brand’s look. Stick to the same fonts, colors, and design elements. This makes your infographic easy to recognize as your brand’s work.
Optimizing Sizes and Dimensions
For a Pinterest infographic, a vertical format with dimensions of 1000 x 3000 pixels is ideal. These sizes are perfect for showing off your content well and attracting attention. Be sure to use them.

Finding and Researching Infographic Data
Getting the right data is key to making a great infographic. You should dig into your industry and the people you want to reach. This means finding topics and numbers that will really interest them. Look through things like industry reports, facts from the government, and information from your own work or website analytics. This will help you pick the most useful and exciting info for your infographic.
The infographic data research part is crucial. It helps you find the most important insights to show in your visuals. Make sure to pick data that is right for your industry. This way, your infographic will be valuable and interesting to your audience. Don’t forget to look at data collection for infographics and industry data for infographics. This will guide you in making content that is both helpful and eye-catching.
| Infographic Data Point | Data Source |
|---|---|
| Best dimensions for infographic Pins on Pinterest | 1000 x 3000 pixels with a Pinterest Pin ratio of 1:3 |
| Infographic pins should not exceed | 600 x 2400 pixels to avoid being cut off |
| Recommended number of points for an infographic | 3-5 points |
| Suggested number of brand colors per image | 2-3 colors for consistency |
| Preferred orientation for Pinterest infographics | Vertical, making images longer rather than wider |
By diving deep and pulling together the right infographic data, you’ll make infographics that stand out on Pinterest. Your audience will be drawn in by visually interesting and informative content.
Crafting Your Infographic’s Story
Once you’ve got your data, the fun starts. Crafting infographic storytelling is key to engaging your audience. It’s all about using the art of infographic narrative structure. This turns your data into an eye-catching and insightful story.
Analyze Data for Insights
Begin by looking closely at your data. Find the patterns, trends, and important insights. Think about the stories behind the numbers. What do you want your audience to take away? By digging deep into the data analysis for infographics, you can create something that really hits home.
Develop a Narrative Flow
Now, it’s time to turn your insights into a story. Consider how to guide your viewers through the info clearly. Make it simple for them to understand and remember the key points. Think about the structure and where to place important data. Also, think about using visual elements that reinforce your message. With a strong infographic narrative structure, you’ll keep your audience hooked and make a big impact.

Designing in Canva: A User-Friendly Platform
Creating eye-catching infographics with Canva is super easy. Even if you’re not a design pro, Canva’s layout makes it a breeze. It has lots of Canva templates to choose from. These templates help you begin your infographic journey. You can change the design, colors, and text to look just right for you.
Customizable Templates
Canva shines with its many Canva templates for social media and infographics. They are perfect for all types of designers. These templates give you a strong starting point. You can tweak them with just a few clicks. Make your infographic fit your brand’s look easily.
Drag-and-Drop Interface
The drag-and-drop feature in Canva is a game-changer. Organizing your design is as easy as clicking and moving things around. Watch how smoothly your infographic builds up. You can play around with the design until you love it.
Branding and Styling Tools
Canva offers more than just templates. It helps you keep your brand look consistent. You can make your own color schemes and pick the perfect fonts. Canva lets you upload your logo and other brand elements. This way, your infographics will always represent your brand well.

Optimizing for Pinterest SEO
When you optimize your Pinterest infographics for Pinterest SEO, you make them easier to find. Start by looking up which keywords your desired audience uses. Then, add these keywords naturally in your infographic’s title, description, and alt text.
Don’t forget about the file names and image tags. Make them SEO-friendly too. This helps make your infographics show up more in Pinterest searches. By optimizing your Pinterest infographics, you can attract more of your ideal viewers. As a result, this can bring more meaningful traffic to your website.
Launching and Promoting Your Infographic
Once your infographic is ready, it’s time to share it. Embed it in a blog post. This way, you can add more details and ask your readers to do something. It’s a great way to get more people to visit your site and interact with your work.
Embedding in a Blog Post
Put your infographic in a blog post to get more attention. It helps make your article better. Readers get to see and understand the topic clearly, through both text and pictures.
Sharing on Social Media
Post your infographic on social media sites like Pinterest, Facebook, and Twitter. This way more people will see it. Write interesting posts that talk about what the infographic covers. Also, ask people to share it with others.
Repurposing for Other Platforms
Think about using your infographic differently. You could turn it into a slide deck for LinkedIn or a video for Instagram. Doing this can get your work in front of more people. It helps make sure your infographic is well-received on many different platforms.

Visual Content Creation for Bloggers
For bloggers, creating visual content for bloggers that’s visually appealing is key. It helps catch your readers’ eyes and stand out online. Tools like Canva are great for making infographics for blog content. These infographics make it easy to share complex info in a clear and attractive design.
Adding Canva for bloggers to your strategy boosts your visual storytelling for blogs. It makes readers remember your content better. Plus, it increases the chance that your posts will be shared on sites like Pinterest.
Top Pinterest Influencers and Their Tactics
Looking at top Pinterest influencers can give you great insights. You can learn about the tactics they use. Check out their content, branding, and how they engage their audience.
This can help you figure out what works. You’ll see the best ways to create and share infographics and eye-catching content on Pinterest.
Studying top Pinterest creators and most popular Pinterest accounts can be very helpful. You’ll get tips for your own Pinterest influencer marketing approach. See how they use visuals to gain more followers and meet their goals.
Learning from the most popular Pinterest accounts shows you what to do. Find out what gets noticed by your audience. Then, use these ideas in your Pinterest plan to make your content stand out.
Scaling Pinterest Pins for Traffic Growth
To grow your traffic on Pinterest, you have to scale your pinning. Even though you can only post 100 pins at once, you can use Canva to make many quickly. Try to pin 50-100 times each day to get more views and boost your interaction.
Using Canva for Batch Pin Creation
Canva’s simple tools and templates make creating pins fun. You can make any pin, like infographics, in groups. This way, you keep your followers interested with new content and bring more people to your site.
Optimal Pinning Frequency
Keeping the right optimla Pinterest pinning frequency matters a lot. Posting 50-100 pins daily keeps you visible and liked by Pinterest’s algorithm. It’s a smart way to be seen more and get more people on your page.
Measuring Infographic Success on Pinterest
It’s essential to keep an eye on how your infographics do on Pinterest. This helps you see their effect and shape what you do next. Always watch important numbers like how many people engage with them, share or save them, and visit your site because of them. This gives you helpful hints for making your Pinterest marketing work better.
Tracking Engagements and Repins
Look at how many people interact with and share your infographics. This tells you if they like what they see and if it’s easy for them to share with others. Find out which ones do well among your audience. Then, make more content that’s sure to appeal to them.
Analyzing Website Traffic Sources
See where your website visitors come from after looking at your infographics. It’s good to count how many people visit and if they do what you hope on your site. This understanding is key to seeing the real effect of your infographics on your marketing goals. Keep a close eye on how well your infographics do. This way, you can make your Pinterest plan even better. You’ll attract more followers and send more traffic to your website.

